ElastiCache里的监控指标分为两类:
- engine-level:由
INFO命令生成 - host level: 从ElastiCache节点的操作系统收集
这些指标每60s收集一次
CPUs
Redis是单线程的(一些做快照的操作可以多CPU进行,但是查询相关的只能在一个线程上进行)
EngineCPUUtilization指标如果过高,可以采取以下措施:
- 使用Redis的
SLOWLOG命令来查看哪些命令执行时间较长,例如KEYS命令
- 使用replica节点来创建快照
- 将读操作转移到replica节点上进行。如果使用非集群模式,则使用reader endpoint;如果使用的是集群模式,则使用
READONLY命令
除了监控EngineCPUUtilization外,还要监控CPUUtilization(整个机器的CPU使用率),例如大量的新连接会带来这个指标过高。对于2核的小机型,这个指标就尤其重要,因为像做快照、计划维护等事件需要计算资源。
内存
INFO命令可以查看和内存相关的指标,其中一个重要的指标就是used_memory, ElastiCache的BytesUsedForCache就是根据它来收集的
DatabaseMemoryUsagePercentage根据BytesUsedForCache / maxmemory来计算,maxmemory可以从INFO命令或Redis Node-Type Specific Parameters
来查看,它由reserved memory
决定,所以会比集群本身的内存小。
为什么需要reserved memory?
当执行backup或failover时,Redis使用额外的内存来将数据写到
.rdb文件,如果这个操作占用内存超过了当前节点的可用内存,整个过程会非常慢。所以推荐使用reserved memory,先预留一部分内存出来给backup或failover用。
例如cache.r5.large节点有14037181030字节,但有25%默认给了预留内存,所以maxmemory只有10527885772.5字节
当DatabaseMemoryUsagePercentage达到100%时会触发redis的驱逐策略(例如LRU),可以通过Evictions指标来观察,这个指标也是通过INFO命令收集的。
Connections
- CurrConnections – The number of concurrent and active connections registered by the Redis engine. This is derived from the
connected_clientsproperty in the Redis INFO command . - NewConnections – The total number of connections that have been accepted by Redis during a given period of time, regardless of whether these connections are still active or closed. This metric is also derived from the Redis INFO command .
To monitor the connections, you need to remember that Redis has a limit called maxclients . ElastiCache’s default and non-modifiable value is 65,000. In other words, you can use up to 65,000 simultaneous connections per node.
Both CurrConnections and NewConnections metrics can help detect and prevent issues. For example, a constant increase of CurrConnections may lead to the exhaustion of the 65,000 available connections. This type of increase may indicate an issue on the application side and connections improperly closed
leaving the connection established on the server side. Although you need to investigate the application’s behavior to address this issue, you can also ensure that your cluster is using tcp-keepalive
to detect and terminate potential dead peers. The default timer for tcp-keepalive is 300 seconds since Redis 3.2.4. For older versions, tcp-keepalive is disabled by default. You can adjust the tcp-keepalive timer in the cluster’s parameter group
.
It’s also important to monitor the NewConnections. However, the maxclient limit of 65,000 doesn’t apply for this metric because it’s the total of connections created during a given time. This doesn’t mean that these connections were simultaneous. One node may receive 100,000 NewConnections during a 1-minute data sample and never reach 2,000 CurrConnections (simultaneous connections). In this particular example, the workload has no risk of reaching the limit of connections Redis can handle. However, the high volume of connections rapidly opened and closed may have an impact on the node’s performance. Creating a TCP connection takes a few milliseconds, which is an extra payload for a Redis operation run by your application.
As a best practice, applications should re-use existing connections to avoid the extra cost of creating a new connection. You can implement connection pooling via your Redis client library (if supported), with a Framework available for your application environment, or build it from the ground.
It’s even more important to control the volume of new connections when your cluster is using the ElastiCache in-transit encryption feature due to the extra time and CPU utilization needed by the TLS handshake.
Replication
The primary node sends a stream of commands to be replicated, given there is at least one read replica. The volume of data being replicated is visible via the ReplicationBytes metric. Although this metric is representative of the write load on the replication group, it doesn’t provide insights into the replication health. For this purpose, you can use the ReplicationLag metric. This offers a very handy representation of how far behind the replica is from the primary node. Starting with Redis 5.0.6, this data is captured in milliseconds. Although rare, you can detect potential issues by monitoring the ReplicationLag metric because spikes of replication lag indicate that the primary node or the replica can’t keep up the pace of the replication. This is an indication that your replica may need to request a full synchronization
. This is a more complex process, involving the creation of a snapshot on the primary node, and could lead to performance degradation. You can identify a full synchronization attempt by combining the ReplicationLag metric and the SaveInProgress metric.
High replication lag is generally a side effect of excessive write activity, network capacity exhaustion, or underlying service degradation.
If your write activity is too high for a single primary node with cluster mode disabled, you need to consider a transition to cluster mode enabled and spread the write operations across multiple shards and their associated primaries. If the replication lag is caused by network exhaustion, you can follow the resolution steps from the Network section of this post.
Latency
You can measure a command’s latency with a set of CloudWatch metrics
that provide aggregated latencies per data structure. These latency metrics are calculated using the commandstats statistic from the Redis INFO command
.
In the following chart, we can see the StringBasedCmdsLatency metric, which is the average latency, in microseconds, of the string-based commands run during a selected time range.
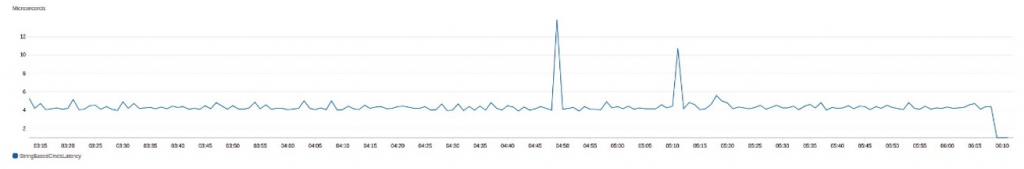
This latency doesn’t include the network and I/O time. This is only the time consumed by Redis to process the operations. For more information about latency metrics, see Metrics for Redis .
If the CloudWatch metrics indicate an increase of latency for a specific data structure, you can use the Redis SLOWLOG to identify the exact commands with the higher runtime.
If your application is experiencing high latency but the CloudWatch metrics indicate a low latency at the Redis engine level, you should investigate the network latency. The Redis CLI provides a latency monitoring tool
that can be very helpful to isolate an issue with the network or the application (min, max, and avg are in milliseconds):
$ redis-cli --latency-history -h mycluster.6advcy.ng.0001.euw1.cache.amazonaws.com
min: 0, max: 8, avg: 0.46 (1429 samples) -- 15.01 seconds range
min: 0, max: 1, avg: 0.43 (1429 samples) -- 15.01 seconds range
min: 0, max: 10, avg: 0.43 (1427 samples) -- 15.00 seconds range
min: 0, max: 1, avg: 0.46 (1428 samples) -- 15.00 seconds range
min: 0, max: 9, avg: 0.44 (1428 samples) -- 15.01 seconds range
Finally, you can also monitor the client side for any activity that could impact the performance of your application and result in increased processing time.
ElastiCache events and Amazon SNS
ElastiCache logs events that relate to your resources, such as a failover, node replacement, scaling operation, scheduled maintenance, and more. Each event includes the date and time, the source name and source type, and a description. You can easily access the events on the ElastiCache console or using the Amazon Command Line Interface (AWS CLI) describe-events command and the ElastiCache API .
The following screenshot shows the events in the ElastiCache console:
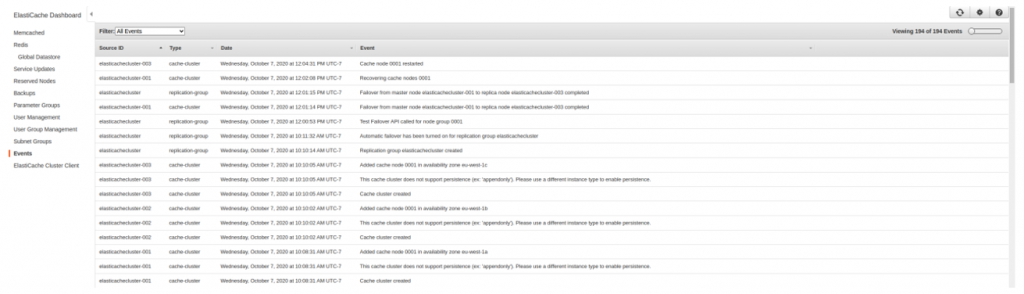
Monitoring events helps you stay informed of the current state of your clusters and, depending on the event, able to take the necessary action. Although ElastiCache events are available via the different implementations already mentioned, we strongly recommend that you configure ElastiCache to send notifications for important events using Amazon Simple Notification Service (Amazon SNS). For more information, see Managing ElastiCache Amazon SNS Notifications .
When adding an SNS topic to an ElastiCache cluster, all important events related to this cluster are published into the SNS topic and can be delivered by email. For more information about the ElastiCache events published for Amazon SNS, see Event Notifications and Amazon SNS .
Using Amazon SNS with your clusters also allows you to programmatically take actions upon ElastiCache events. For example, AWS Lambda functions can subscribe to SNS topics and run if a specific event is detected. For more information, see Monitor Amazon ElastiCache for Redis (cluster mode disabled) read replica endpoints using AWS Lambda, Amazon Route 53, and Amazon SNS .
原文:https://aws.amazon.com/cn/blogs/database/monitoring-best-practices-with-amazon-elasticache-for-redis-using-amazon-cloudwatch/